Changes in ice volume

Changes in ice volume
0
(0)

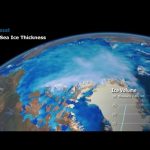
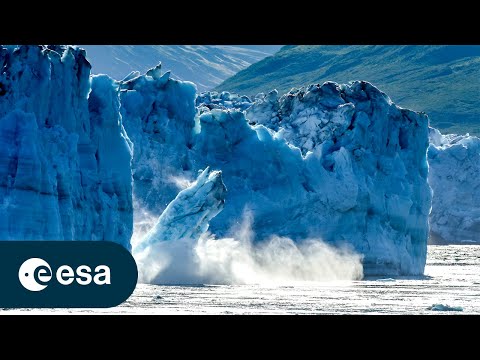
This animation shows changes in ice volume in Antarctica, Greenland and the Arctic ocean measured by the CryoSat satellite, 2010–15. CryoSat’s readings also contribute to our knowledge of global ocean depth.

More about CryoSat:
http://www.esa.int/Our_Activities/Observing_the_Earth/CryoSat

Credit: ESA/CPOM/UCL/D Sandwell/Planetary Visions

Similar Posts:

How useful was this post?

Click on a star to rate it!

Average rating 0 / 5. Vote count: 0

No votes so far! Be the first to rate this post.

As you found this post useful…

Follow us on social media!

We are sorry that this post was not useful for you!

Let us improve this post!

Tell us how we can improve this post?

Comments

7 responses to “Changes in ice volume”

  1. 2 Hiii IAM sura From Iraq

  2. Disgusting governments and businesses aren't acting quicker!

  3. 0:150:30 is there a hole or what is that?

  4. Is the measurement over the (North) Artic including precipitation and Humidity change?

  5. Thank you for uploading this informative video 🙂

  6. so no explanation an what these graphs mean and what their effects is? come on.

  7. Doesn't the last graph show a random pattern?

Leave a Reply

Your email address will not be published. Required fields are marked *