Tag: Ice sheets

  • Contributors to sea-level rise

    Contributors to sea-level rise

    The physical processes causing global sea-level rise are highlighted in the animation. The main causes are thermal expansion of oceans, as they accumulate the excess heat caused by greenhouse gas emissions, the melting of ice from the ice sheets and glaciers, as well as changes in land water storage such as lakes. Regionally, sea level changes vary quite dramatically. The reasons for this are different to the global causes of sea-level changes and include changes to sea water density, influenced by salinity and temperature.

    The Climate Change Initiative Open Data Portal: http://cci.esa.int

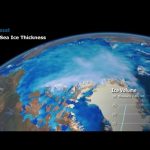
    Credits: Planetary Visions

  • Larsen-C crack

    Larsen-C crack

    The Copernicus Sentinel-1 satellite mission is monitoring the growing crack in Antarctica’s Larsen-C ice shelf. When the ice shelf breaks off or ‘calves’, it will create one of the largest icebergs ever recorded – but exactly how long this will take is difficult to predict.

    This animation demonstrates how scientists analyse radar data from Sentinel-1 to monitor the crack. This includes combining radar images to create an ‘interferogram’. Learn more: http://www.esa.int/spaceinimages/Images/2017/04/Larsen-C_crack_interferogram

    Credits: contains modified Copernicus Sentinel data (2017), processed by A. Hogg/CPOM/Priestly Centre, CC BY-SA 3.0 IGO

  • Changes in ice volume

    Changes in ice volume

    This animation shows changes in ice volume in Antarctica, Greenland and the Arctic ocean measured by the CryoSat satellite, 2010–15. CryoSat’s readings also contribute to our knowledge of global ocean depth.

    More about CryoSat:
    http://www.esa.int/Our_Activities/Observing_the_Earth/CryoSat

    Credit: ESA/CPOM/UCL/D Sandwell/Planetary Visions