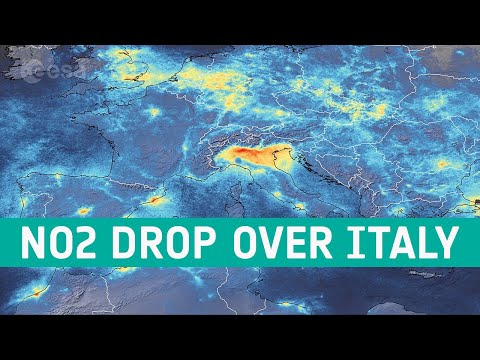
This animation, using data from the Copernicus Sentinel-5P satellite, shows the nitrogen dioxide emissions from 20 December 2019 until 16 March 2020 – using a 10-day moving average. The drop in emissions in late-January is visible, coinciding with the nationwide quarantine, and from the beginning of March, the nitrogen dioxide levels have begun to increase.
Learn more: http://bit.ly/COVID19NitrogenDioxideOverChina
Credits: contains modified Copernicus Sentinel data (2019-20), processed by ESA, CC BY-SA 3.0 IGO
★ Subscribe: http://bit.ly/ESAsubscribe and click twice on the bell button to receive our notifications.
Check out our full video catalog: http://bit.ly/SpaceInVideos
Follow us on Twitter: http://bit.ly/ESAonTwitter
On Facebook: http://bit.ly/ESAonFacebook
On Instagram: http://bit.ly/ESAonInstagram
On Flickr: http://bit.ly/ESAonFlickr
We are Europe’s gateway to space. Our mission is to shape the development of Europe’s space capability and ensure that investment in space continues to deliver benefits to the citizens of Europe and the world. Check out http://www.esa.int/ESA to get up to speed on everything space related.
Copyright information about our videos is available here: http://www.esa.int/spaceinvideos/Terms_and_Conditions
#ESA
#


Leave a Reply